


Over the past few weeks, the Australian Bureau of Statistics (ABS) released the June 2023 National Accounts – reporting changes in economic activity, GDP, terms of trade and household savings rates, delivering valuable data on Australia’s economic health.
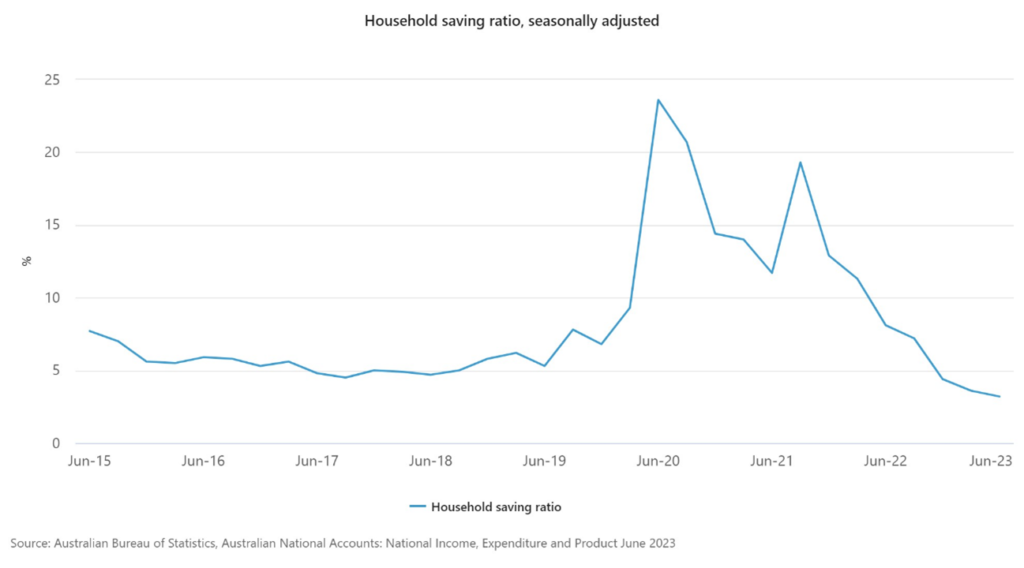
In this most recent report, the national net household saving ratio was found to have dropped to 3.2% (down from 3.6%), which signifies a seventh consecutive reduction and is the lowest level reported since 2008 (which coincides with the Global Financial Crisis).
The net household saving ratio is defined by the ABS as the proportion of net disposable income of all households that is not consumed in the reporting period, or simply, the percentage of disposable income that is not spent each quarter.
Historically, the net household saving ratio has fluctuated over time based on consumer habits, economic conditions and economic levers implemented by the Reserve Bank of Australia (RBA), however, the long-term average has been 9.4% since reporting began in 1959. This ratio averaged 11% across the 1960s and rose to a peak of 18.5% in the mid-1970s, before falling to around 6% during the 1980s and 3% throughout the 90s.
In more recent times, the savings rate rose to a high of 23.6% in 2020 as a result of Government stimulus packages, low interest rates and reduced consumer spending during COVID lockdown periods, depicted in the chart below:
This high level of savings throughout the COVID period allowed households to build up additional savings cushions. AMP has reported that these excess savings reached a high of $253 billion at the peak, representing 22% of annual consumer spending, providing a valuable buffer for households to draw on in future.
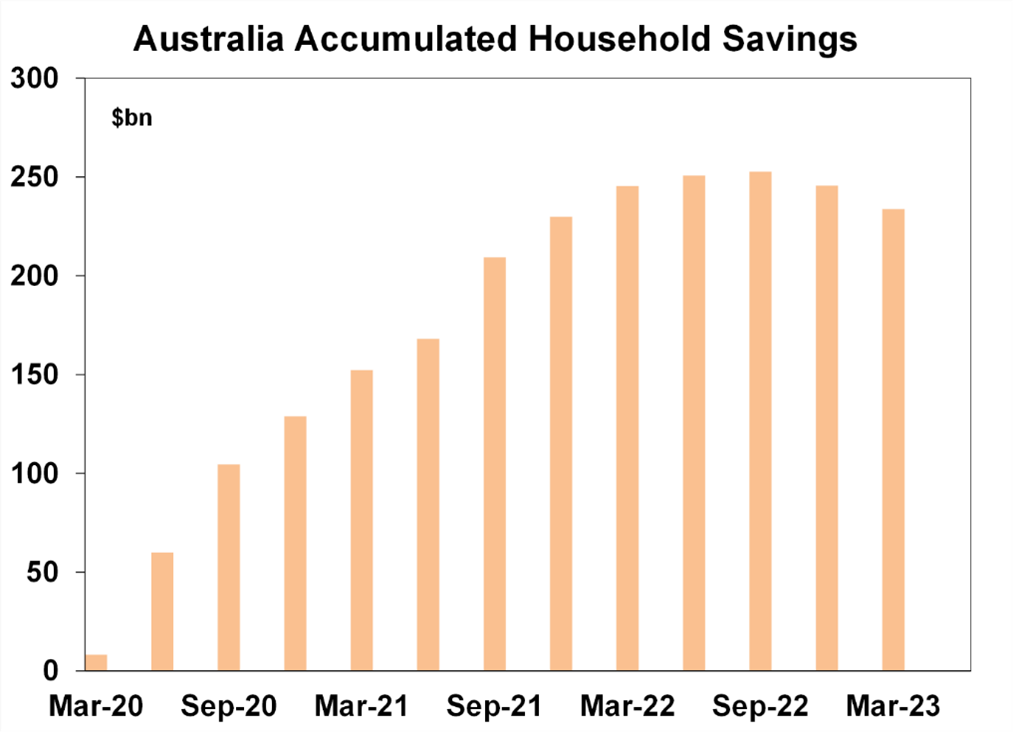
Source: ABS, AMP
It is important to note that this savings buffer was not evenly distributed across all demographics. Households aged 55+ hold a high proportion of the overall accumulated savings, including the highest share of bank deposits. AMP has suggested that middle-aged households (aged 35-54) proportionately have little excess savings, and recently have been the most negatively impacted by the rising interest rate environment, holding the largest portion of mortgage debt. Therefore, even if accumulated savings appear elevated, there is a large degree of variance in outcomes across demographics nationally.
So, how long is this National savings buffer expected to last? As always, economic opinion is varied. Barrenjoey chief economist Jo Masters recently stated that this savings buffer could be gone by as early as March.
AMP have more conservatively predicted that the continued roll-off effect of fixed rate to variable mortgages will accelerate the drawdown of savings, and therefore most accumulated additional savings will be exhausted by late 2024. Our own discussions with industry professionals verifies this trend, with many seeing clients drawing heavily on buffers created in savings and mortgage offset accounts in recent times, largely driven by increased mortgage repayments and overall increases to cost of living expenses.
Savings and cashflow management is an integral part of personal wealth management and being proactive about your personal finances and seeking advice (reviewing your mortgage interest rate, cashflow and budget to ensure you are continuing to generate sufficient savings for the future) can ensure you remain in a financially sound position, regardless of changes in the broader economy.